
Annual Water Data Report
Documentation
Downstream order and station number
Numbering system for wells and miscellaneous sites
Explanation of stage- and water-discharge records
Explanation of precipitation records
Explanation of water-quality records
Surface-water-quality records
Explanation of ground-water level records
Ground-water-quality data
Definition of terms
Downstream order and station number
Since October 1, 1950, hydrologic-station records in USGS reports have been listed in order of downstream direction along the main stream. All stations on a tributary entering upstream from a main-stream station are listed before that station. A station on a tributary entering between two mainstream stations is listed between those stations. A similar order is followed in listing stations on first rank, second rank, and other ranks of tributaries. The rank of any tributary on which a station is located with respect to the stream to which it is immediately tributary is indicated by an indention in that list of stations in the front of this report. Each indentation represents one rank. This downstream order and system of indentation indicates which stations are on tributaries between any two stations and the rank of the tributary on which each station is located.
As an added means of identification, each hydrologic station and partial-record station has been assigned a station number. These station numbers are in the same downstream order used in this report. In assigning a station number, no distinction is made between partial-record stations and other stations; therefore, the station number for a partial-record station indicates downstream-order position in a list composed of both types of stations. Gaps are consecutive. The complete 8-digit (or 10-digit) number for each station such as 09004100, which appears just to the left of the station name, includes a 2-digit part number "09" plus the 6-digit (or 8-digit) downstream order number "004100." In areas of high station density, an additional two digits may be added to the station identification number to yield a 10-digit number. The stations are numbered in downstream order as described above between stations of consecutive 8- digit numbers.
Numbering system for wells and miscellaneous sites
The USGS well and miscellaneous site-numbering system is based on the grid system of latitude and longitude. The system provides the geographic location of the well or miscellaneous site and a unique number for each site. The number consists of 15 digits. The first 6 digits denote the degrees, minutes, and seconds of latitude, and the next 7 digits denote degrees, minutes, and seconds of longitude; the last 2 digits are a sequential number for wells within a 1-second grid. In the event that the latitude-longitude coordinates for a well and miscellaneous site are the same, a sequential number such as "01," "02," and so forth, would be assigned as one would for wells (see fig. 1). The 8-digit, downstream order station numbers are not assigned to wells and miscellaneous sites where only random water-quality samples or discharge measurements are taken.
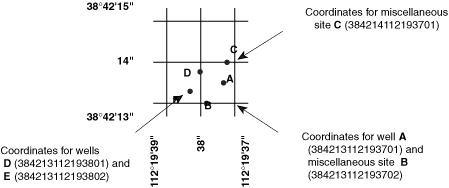
Figure 1. Example of system for numbering wells and miscellaneous sites (latitude and longitude).
In addition to the well number that is based on the latitude and longitude for each well, another well number may be provided which in many States is based on the Public Land Survey System, a set of rectangular surveys that is used to identify land parcels. This well number is familiar to the water users in, for example, Utah and shows the location of the well by quadrant, township, range section, and position within the section (see fig. 2).
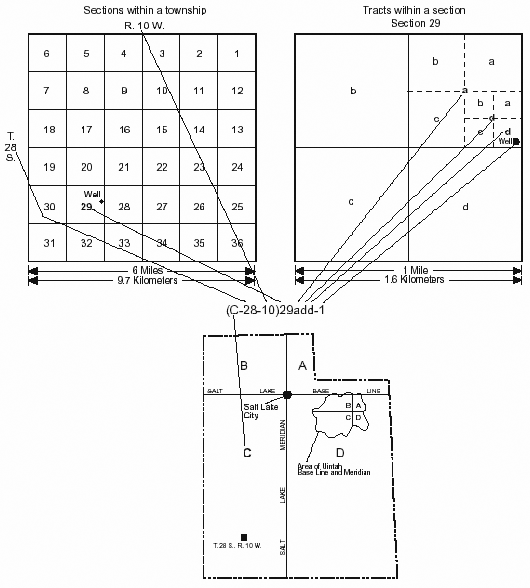
Figure 2. Example of system for numbering wells and miscellaneous sites (township and range).
Some Water Science Centers also identify each ground-water site by a local number that consists of an abbreviation of the county name as well as the township, range and section, and a four-digit number assigned to the well. Naming conventions specific to an individual Water Science Center can be obtained locally from each USGS Water Science Center.
Explanation of stage- and water-discharge records
Data Collection and Computation
The base data collected at gaging stations consist of records of stage and measurements of discharge of streams or canals, and stage, surface area, and volume of lakes or reservoirs. In addition, observations of factors affecting the stage-discharge relation or the stage-capacity relation, weather records, and other information are used to supplement base data in determining the daily flow or volume of water in storage. Records of stage are obtained from a water-stage recorder that is either downloaded electronically in the field to a laptop computer or similar device or is transmitted using telemetry such as GOES satellite, land-line or cellular-phone modems, or by radio transmission. Measurements of discharge are made with a current meter or acoustic Doppler current profiler, using the general methods adopted by the USGS. These methods are described in standard textbooks, USGS Water- Supply Paper 2175, and the Techniques of Water-Resources Investigations of the United States Geological Survey (TWRIs), Book 3, Chapters A1 through A19 and Book 8, Chapters A2 and B2, which may be accessed from http://water.usgs.gov/ pubs/twri/. The methods are consistent with the American Society for Testing and Materials (ASTM) standards and generally follow the standards of the International Organization for Standardization (ISO).
For stream-gaging stations, discharge-rating tables for any stage are prepared from stage-discharge curves. If extensions to the rating curves are necessary to express discharge greater than measured, the extensions are made on the basis of indirect measurements of peak discharge (such as slope-area or contracted-opening measurements, or computation of flow over dams and weirs), step-backwater techniques, velocity-area studies, and logarithmic plotting. The daily mean discharge is computed from gage heights and rating tables, then the monthly and yearly mean discharges are computed from the daily values. If the stage-discharge relation is subject to change because of frequent or continual change in the physical features of the stream channel, the daily mean discharge is computed by the shifting-control method in which correction factors that are based on individual discharge measurements and notes by engineers and observers are used when applying the gage heights to the rating tables. If the stage-discharge relation for a station is temporarily changed by the presence of aquatic growth or debris on the controlling section, the daily mean discharge is computed by the shifting-control method.
The stage-discharge relation at some stream-gaging stations is affected by backwater from reservoirs, tributary streams, or other sources. Such an occurrence necessitates the use of the slope method in which the slope or fall in a reach of the stream is a factor in computing discharge. The slope or fall is obtained by means of an auxiliary gage at some distance from the base gage. An index velocity is measured using ultrasonic or acoustic instruments at some stream-gaging stations, and this index velocity is used to calculate an average velocity for the flow in the stream. This average velocity along with a stage-area relation is then used to calculate average discharge. At some stations, the stage-discharge relation is affected by changing stage. At these stations, the rate of change in stage is used as a factor in computing discharge.
At some stream-gaging stations in the northern United States, the stage-discharge relation is affected by ice in the winter; therefore, computation of the discharge in the usual manner is impossible. Discharge for periods of ice effect is computed on the basis of gage-height record and occasional winter-discharge measurements. Consideration is given to the available information on temperature and precipitation, notes by gage observers and hydrologists, and comparable records of discharge from other stations in the same or nearby basins.
For a lake or reservoir station, capacity tables giving the volume or contents for any stage are prepared from stage-area relation curves defined by surveys. The application of the stage to the capacity table gives the contents, from which the daily, monthly, or yearly changes are computed.
If the stage-capacity curve is subject to changes because of deposition of sediment in the reservoir, periodic resurveys of the reservoir are necessary to define new stage-capacity curves. During the period between reservoir surveys, the computed contents may be increasingly in error due to the gradual accumulation of sediment.
For some stream-gaging stations, periods of time occur when no gage-height record is obtained or the recorded gage height is faulty and cannot be used to compute daily discharge or contents. Such a situation can happen when the recorder stops or otherwise fails to operate properly, the intakes are plugged, the float is frozen in the well, or for various other reasons. For such periods, the daily discharges are estimated on the basis of recorded range in stage, prior and subsequent records, discharge measurements, weather records, and comparison with records from other stations in the same or nearby basins. Likewise, lake or reservoir volumes may be estimated on the basis of operator's log, prior and subsequent records, inflow-outflow studies, and other information.
Data Presentation
The records published for each continuous record surface-water discharge station (stream-gaging station) consist of five parts: (1) the station manuscript or description; (2) the data table of daily mean values of discharge for the current water year with summary data; (3) a tabular statistical summary of monthly mean flow data for a designated period, by water year; (4) a summary statistics table that includes statistical data of annual, daily, and instantaneous flows as well as data pertaining to annual runoff, 7-day low-flow minimums, and flow duration; and (5) a hydrograph of discharge.
Station Manuscript
The manuscript provides, under various headings, descriptive information, such as station location; period of record; historical extremes outside the period of record; record accuracy; and other remarks pertinent to station operation and regulation. The following information, as appropriate, is provided with each continuous record of discharge or lake content. Comments follow that clarify information presented under the various headings of the station description.
LOCATION.-Location information is obtained from the most accurate maps available. The location of the gaging station with respect to the cultural and physical features in the vicinity and with respect to the reference place mentioned in the station name is given. River mileages, given for only a few stations, were determined by methods given in "River Mileage Measurement," Bulletin 14, Revision of October 1968, prepared by the Water Resources Council or were provided by the U.S. Army Corps of Engineers.
DRAINAGE AREA.-Drainage areas are measured using the most accurate maps available. Because the type of maps available varies from one drainage basin to another, the accuracy of drainage areas likewise varies. Drainage areas are updated as better maps become available.
PERIOD OF RECORD.-This term indicates the time period for which records have been published for the station or for an equivalent station. An equivalent station is one that was in operation at a time that the present station was not and whose location was such that its flow reasonably can be considered equivalent to flow at the present station.
REVISED RECORDS.-If a critical error in a published site data sheet is discovered, a revision is included (where?) in the next publishing cycle following discovery of the error.
GAGE.-The type of gage in current use, the datum of the current gage referred to a standard datum, and a condensed history of the types, locations, and datums of previous gages are given under this heading.
REMARKS.-All periods of estimated daily discharge either will be identified by date in this paragraph of the station description for water discharge stations or flagged in the daily discharge table. (See section titled Identifying Estimated Daily Discharge.) Information is presented relative to the accuracy of the records, to special methods of computation, and to conditions that affect natural flow at the station. In addition, information may be presented pertaining to average discharge data for the period of record; to extremes data for the period of record and the current year; and, possibly, to other pertinent items. For reservoir stations, information is given on the dam forming the reservoir, the capacity, the outlet works and spillway, and the purpose and use of the reservoir.
COOPERATION.-Records provided by a cooperating organization or obtained for the USGS by a cooperating organization are identified here.
EXTREMES OUTSIDE PERIOD OF RECORD.-Information here documents major floods or unusually low flows that occurred outside the stated period of record. The information may or may not have been obtained by the USGS.
REVISIONS.-Records are revised if errors in published records are discovered. Appropriate updates are made in the USGS distributed data system, NWIS, and subsequently to its Web-based national data system, NWISWeb (http://water.usgs.gov/nwis/nwis). Users are encouraged to obtain all required data from NWIS or NWISWeb to ensure that they have the most recent data updates. Updates to NWISWeb are made on an annual basis.
Although rare, occasionally the records of a discontinued gaging station may need revision. Because no current or, possibly, future station manuscript would be published for these stations to document the revision in a REVISED RECORDS entry, users of data for these stations who obtained the record from previously published data reports may wish to contact the USGS Water Science Center in the state where the station is located to determine if the published records were revised after the station was discontinued. If, however, the data for a discontinued station were obtained by computer retrieval, the data would be current. Any published revision of data is always accompanied by revision of the corresponding data in computer storage.
Manuscript information for lake or reservoir stations differs from that for stream stations in the nature of the REMARKS and in the inclusion of a stage-capacity table when daily volumes are given.
Peak Discharge Greater than Base Discharge
Tables of peak discharge above base discharge are included for some stations where secondary instantaneous peak discharge data are used in flood-frequency studies of highway and bridge design, flood-control structures, and other flood related projects. The base discharge value is selected so an average of three peaks a year will be reported. This base discharge value has a recurrence interval of approximately 1.1 years or a 91-percent chance of exceedence in any 1 year.
Data Table of Daily Mean Values
The daily table of discharge records for streamgaging stations gives mean discharge for each day of the water year. In the monthly summary for the table, the line headed TOTAL gives the sum of the daily figures for each month; the line headed MEAN gives the arithmetic average flow in cubic feet per second for the month; and the lines headed MAX and MIN give the maximum and minimum daily mean discharges, respectively, for each month. Discharge for the month is expressed in cubic feet per second per square mile (line headed CFSM); or in inches (line headed IN); or in acrefeet (line headed AC-FT). Values for cubic feet per second per square mile and runoff in inches or in acre-feet may be omitted if extensive regulation or diversion is in effect or if the drainage area includes large noncontributing areas. At some stations, monthly and (or) yearly observed discharges are adjusted for reservoir storage or diversion, or diversion data or reservoir volumes are given. These values are identified by a symbol and a corresponding footnote.
Statistics of Monthly Mean Data
A tabular summary of the mean (line headed MEAN), maximum (MAX), and minimum (MIN) of monthly mean flows for each month for a designated period is provided below the mean values table. The water years of the first occurrence of the maximum and minimum monthly flows are provided immediately below those values. The designated period will be expressed as FOR WATER YEARS __-__, BY WATER YEAR (WY), and will list the first and last water years of the range of years selected from the PERIOD OF RECORD paragraph in the station manuscript. The designated period will consist of all of the station record within the specified water years, including complete months of record for partial water years, and may coincide with the period of record for the station. The water years for which the statistics are computed are consecutive, unless a break in the station record is indicated in the manuscript.
Summary Statistics
A table titled SUMMARY STATISTICS follows the statistics of monthly mean data tabulation. This table consists of four columns with the first column containing the line headings of the statistics being reported. The table provides a statistical summary of yearly, daily, and instantaneous flows, not only for the current water year but also for the previous calendar year and for a designated period, as appropriate. The designated period selected, WATER YEARS __-__, will consist of all of the station records within the specified water years, including complete months of record for partial water years, and may coincide with the period of record for the station. The water years for which the statistics are computed are consecutive, unless a break in the station record is indicated in the manuscript. All of the calculations for the statistical characteristics designated ANNUAL (see line headings below), except for the ANNUAL 7-DAY MINIMUM statistic, are calculated for the designated period using complete water years. The other statistical characteristics may be calculated using partial water years. The date or water year, as appropriate, of the first occurrence of each statistic reporting extreme values of discharge is provided adjacent to the statistic. Repeated occurrences may be noted in the REMARKS paragraph of the manuscript or in footnotes. Because the designated period may not be the same as the station period of record published in the manuscript, occasionally the dates of occurrence listed for the daily and instantaneous extremes in the designated-period column may not be within the selected water years listed in the heading. When the dates of occurrence do not fall within the selected water years listed in the heading, it will be noted in the REMARKS paragraph or in footnotes. Selected streamflow duration-curve statistics and runoff data also are given. Runoff data may be omitted if extensive regulation or diversion of flow is in effect in the drainage basin.
The following summary statistics data are provided with each continuous record of discharge. Comments that follow clarify information presented under the various line headings of the SUMMARY STATISTICS table.
ANNUAL TOTAL.-The sum of the daily mean values of discharge for the year.
ANNUAL MEAN.-The arithmetic mean for the individual daily mean discharges for the year noted or for the designated period.
HIGHEST ANNUAL MEAN.-The maximum annual mean discharge occurring for the designated period.
LOWEST ANNUAL MEAN.-The minimum annual mean discharge occurring for the designated period.
HIGHEST DAILY MEAN.-The maximum daily mean discharge for the year or for the designated period.
LOWEST DAILY MEAN.-The minimum daily mean discharge for the year or for the designated period.
ANNUAL 7-DAY MINIMUM.-The lowest mean discharge for 7 consecutive days for a calendar year or a water year. Note that most low-flow frequency analyses of annual 7-day minimum flows use a climatic year (April 1-March 31). The date shown in the summary statistics table is the initial date of the 7-day period. This value should not be confused with the 7-day 10-year low-flow statistic.
MAXIMUM PEAK FLOW.-The maximum instantaneous peak discharge occurring for the water year or designated period. Occasionally the maximum flow for a year may occur at midnight at the beginning or end of the year, on a recession from or rise toward a higher peak in the adjoining year. In this case, the maximum peak flow is given in the table and the maximum flow may be reported in a footnote or in the REMARKS paragraph in the manuscript.
MAXIMUM PEAK STAGE.-The maximum instantaneous peak stage occurring for the water year or designated period. Occasionally the maximum stage for a year may occur at midnight at the beginning or end of the year, on a recession from or rise toward a higher peak in the adjoining year. In this case, the maximum peak stage is given in the table and the maximum stage may be reported in the REMARKS paragraph in the manuscript or in a footnote. If the dates of occurrence of the maximum peak stage and maximum peak flow are different, the REMARKS paragraph in the manuscript or a footnote may be used to provide further information.
INSTANTANEOUS LOW FLOW.-The minimum instantaneous discharge occurring for the water year or for the designated period.
ANNUAL RUNOFF.-Indicates the total quantity of water in runoff for a drainage area for the year. Data reports may use any of the following units of measurement in presenting annual runoff data:
Acre-foot (AC-FT) is the quantity of water required to cover 1 acre to a depth of 1 foot and is equivalent to 43,560 cubic feet or about 326,000 gallons or 1,233 cubic meters.
Cubic feet per square mile (CFSM) is the average number of cubic feet of water flowing per second from each square mile of area drained, assuming the runoff is distributed uniformly in time and area.
Inches (INCHES) indicate the depth to which the drainage area would be covered if all of the runoff for a given time period were uniformly distributed on it.
10 PERCENT EXCEEDS.-The discharge that has been exceeded 10 percent of the time for the designated period.
50 PERCENT EXCEEDS.-The discharge that has been exceeded 50 percent of the time for the designated period.
90 PERCENT EXCEEDS.-The discharge that has been exceeded 90 percent of the time for the designated period.
Data collected at partial-record stations follow the information for continuous-record sites. Data for partial-record discharge stations are presented in two tables. The first table lists annual maximum stage and discharge at crest-stage stations, and the second table lists discharge measurements at lowflow partial-record stations. The tables of partialrecord stations are followed by a listing of discharge measurements made at sites other than continuous-record or partial-record stations. These measurements are often made in times of drought or flood to give better areal coverage to those events. Those measurements and others collected for a special reason are called measurements at miscellaneous sites.
Identifying Estimated Daily Discharge
Estimated daily-discharge values published in the water-discharge tables of annual State data reports are identified. This identification is shown either by flagging individual daily values with the letter "e" and noting in a table footnote, "e- Estimated," or by listing the dates of the estimated record in the REMARKS paragraph of the station description.
Accuracy of Field Data and Computed Results
The accuracy of streamflow data depends primarily on (1) the stability of the stage-discharge relation or, if the control is unstable, the frequency of discharge measurements, and (2) the accuracy of observations of stage, measurements of discharge, and interpretations of records.
The degree of accuracy of the records is stated in the REMARKS in the station description. "Excellent" indicates that about 95 percent of the daily discharges are within 5 percent of the true value; "good" within 10 percent; and "fair," within 15 percent. "Poor" indicates that daily discharges have less than "fair" accuracy. Different accuracies may be attributed to different parts of a given record.
Values of daily mean discharge in this report are shown to the nearest hundredth of a cubic foot per second for discharges of less than 1 ft3/s; to the nearest tenths between 1.0 and 10 ft3/s; to whole numbers between 10 and 1,000 ft3/s; and to three significant figures above 1,000 ft3/s. The number of significant figures used is based solely on the magnitude of the discharge value. The same rounding rules apply to discharge values listed for partial-record stations.
Discharge at many stations, as indicated by the monthly mean, may not reflect natural runoff due to the effects of diversion, consumption, regulation by storage, increase or decrease in evaporation due to artificial causes, or to other factors. For such stations, values of cubic feet per second per square mile and of runoff in inches are not published unless satisfactory adjustments can be made for diversions, for changes in contents of reservoirs, or for other changes incident to use and control. Evaporation from a reservoir is not included in the adjustments for changes in reservoir contents, unless it is so stated. Even at those stations where adjustments are made, large errors in computed runoff may occur if adjustments or losses are large in comparison with the observed discharge.
Other Data Records Available
Information of a more detailed nature than that published for most of the stream-gaging stations such as discharge measurements, gage-height records, and rating tables is available from the USGS Water Science Center. Also, most streamgaging station records are available in computer usable form and many statistical analyses have been made.
Information on the availability of unpublished data or statistical analyses may be obtained from the USGS Water Science Center in the state where the station is located.
Explanation of precipitation records
Data Collection and Computation
Rainfall data generally are collected using electronic data loggers that measure the rainfall in 0.01-inch increments every 15 minutes using either a tipping-bucket rain gage or a collection well gage. Twenty-four hour rainfall totals are tabulated and presented. A 24-hour period extends from just past midnight of the previous day to midnight of the current day. Snowfall-affected data can result during cold weather when snow fills the rain-gage funnel and then melts as temperatures rise. Snowfall-affected data are subject to errors. Missing values are indicated by this symbol "---" in the table.
Data Presentation
Precipitation records collected at surface-water gaging stations are identified with the same station number and name as the stream-gaging station. Where a surface-water daily-record station is not available, the precipitation record is published with its own name and latitude-longitude identification number.
Information pertinent to the history of a precipitation station is provided in descriptive headings preceding the tabular data. These descriptive headings give details regarding location, period of record, and general remarks. The following information is provided with each precipitation station. Comments that follow clarify information presented under the various headings of the station description.
LOCATION.-See Data Presentation in the EXPLANATION OF STAGE- AND WATERDISCHARGE RECORDS section of this report (same comments apply).
PERIOD OF RECORD.-See Data Presentation in the EXPLANATION OF STAGE- AND WATERDISCHARGE RECORDS section of this report (same comments apply).
INSTRUMENTATION.-Information on the type of rainfall collection system is given.
REMARKS.-Remarks provide added information pertinent to the collection, analysis, or computation of records.
Explanation of water-quality records
Collection and Examination of Data Surface-water samples for analysis usually are collected at or near stream-gaging stations. The quality-of-water records are given immediately following the discharge records at these stations. The descriptive heading for water-quality records gives the period of record for all water-quality data; the period of daily record for parameters that are measured on a daily basis (specific conductance, water temperature, sediment discharge, and so forth); extremes for the current year; and general remarks.
For ground-water records, no descriptive statements are given; however, the well number, depth of well, sampling date, or other pertinent data are given in the table containing the chemical analyses of the ground water.
Water Analysis
Most of the methods used for collecting and analyzing water samples are described in the TWRIs, which may be accessed from http:// water.usgs.gov/pubs/twri/.One sample can define adequately the water quality at a given time if the mixture of solutes throughout the stream cross section is homogeneous. However, the concentration of solutes at different locations in the cross section may vary considerably with different rates of water discharge, depending on the source of material and the turbulence and mixing of the stream. Some streams must be sampled at several verticals to obtain a representative sample needed for an accurate mean concentration and for use in calculating load.
Chemical-quality data published in this report are considered to be the most representative values available for the stations listed. The values reported represent water-quality conditions at the time of sampling as much as possible, consistent with available sampling techniques and methods of analysis. In the rare case where an apparent inconsistency exists between a reported pH value and the relative abundance of carbon dioxide species (carbonate and bicarbonate), the inconsistency is the result of a slight uptake of carbon dioxide from the air by the sample between measurement of pH in the field and determination of carbonate and bicarbonate in the laboratory.
For chemical-quality stations equipped with digital monitors, the records consist of daily maximum and minimum values (and sometimes mean or median values) for each constituent measured and are based on 15-minute or 1-hour intervals of recorded data beginning at 0000 hours and ending at 2400 hours for the day of record.
NWIS Help - Parameter Codes · Query for Parameter Name or Code
NWIS Help - Medium Codes
Surface-water-quality records
Records of surface-water quality ordinarily are obtained at or near stream-gaging stations because discharge data are useful in the interpretation of surface-water quality. Records of surface-water quality in this report involve a variety of types of data and measurement frequencies.
Classification of Records
Water-quality data for surface-water sites are grouped into one of three classifications. A continuous-record station is a site where data are collected on a regularly scheduled basis. Frequency may be one or more times daily, weekly, monthly, or quarterly. A partial-record station is a site where limited water-quality data are collected systematically over a period of years. Frequency of sampling is usually less than quarterly. A miscellaneous sampling site is a location other than a continuous- or partial-record station, where samples are collected to give better areal coverage to define water-quality conditions in the river basin.
A careful distinction needs to be made between continuous records as used in this report and continuous recordings that refer to a continuous graph or a series of discrete values recorded at short intervals. Some records of water quality, such as temperature and specific conductance, may be obtained through continuous recordings; however, because of costs, most data are obtained only monthly or less frequently. Locations of stations for which records on the quality of surface water appear in this report may be published as a USGS Annual Scientific Investigations Report by State, and may be accessed from http://pubs.usgs.gov, or the Related Information and Publications page of this Web Site.
Accuracy of the Records
One of four accuracy classifications is applied for measured physical properties at continuous-record stations on a scale ranging from poor to excellent. The accuracy rating is based on data values recorded before any shifts or corrections are made. Additional consideration also is given to the amount of publishable record and to the amount of data that have been corrected or shifted.
Arrangement of Records
Water-quality records collected at a surface-water daily record station are published immediately following that record, regardless of the frequency of sample collection. Station number and name are the same for both records. Where a surface-water daily record station is not available or where the water quality differs significantly from that at the nearby surface-water station, the continuing water-quality record is published with its own station number and name in the regular downstream-order sequence. Water-quality data for partial-record stations and for miscellaneous sampling sites appear in separate tables following the table of discharge measurements at miscellaneous sites.
Onsite Measurements and Sample Collection
In obtaining water-quality data, a major concern is assuring that the data obtained represent the naturally occurring quality of the water. To ensure this, certain measurements, such as water temperature, pH, and dissolved oxygen, must be made onsite when the samples are collected. To assure that measurements made in the laboratory also represent the naturally occurring water, carefully prescribed procedures must be followed in collecting the samples, in treating the samples to prevent changes in quality pending analysis, and in shipping the samples to the laboratory. Procedures for onsite measurements and for collecting, treating, and shipping samples are given in TWRIs Book 1, Chapter D2; Book 3, Chapters A1, A3, and A4; and Book 9, Chapters A1-A9. Most of the methods used for collecting and analyzing water samples are described in the TWRIs, which may be accessed from http://water.usgs.gov/pubs/twri/. Also, detailed information on collecting, treating, and shipping samples can be obtained from the USGS Water Science Center.
Rating the accuracy of continuous water-quality records
[≤, less than or equal to; ±, plus or minus value shown; °C, degree Celsius; >, greater than; %, percent; mg/L, milligram per liter; pH unit, standard pH unit]
Water Temperature
Water temperatures are measured at most of the water-quality stations. In addition, water temperatures are taken at the time of discharge measurements for water-discharge stations. For stations where water temperatures are taken manually once or twice daily, the water temperatures are taken at about the same time each day. Large streams have a small diurnal temperature change; shallow streams may have a daily range of several degrees and may follow closely the changes in air temperature. Some streams may be affected by waste-heat discharges.
At stations where recording instruments are used, either mean temperatures or maximum and minimum temperatures for each day are published. Water temperatures measured at the time of water discharge-measurements are on file in the USGS Water Science Center in the State where the station is located.
Sediment
Suspended-sediment concentrations are determined from samples collected by using depth-integrating samplers. Samples usually are obtained at several verticals in the cross section, or a single sample may be obtained at a fixed point and a coefficient applied to determine the mean concentration in the cross section.
During periods of rapidly changing flow or rapidly changing concentration, samples may be collected more frequently (twice daily or, in some instances, hourly). The published sediment discharges for days of rapidly changing flow or concentration are computed by the subdivided-day method (time-discharge weighted average). Therefore, for those days when the published sediment discharge value differs from the value computed as the product of discharge times mean concentration times 0.0027, the reader can assume that the sediment discharge for that day was computed by the subdivided-day method. For periods when no samples were collected, daily discharges of suspended sediment were estimated on the basis of water discharge, sediment concentrations observed immediately before and after the periods, and suspended-sediment loads for other periods of similar discharge.
At other stations, suspended-sediment samples are collected periodically at many verticals in the stream cross section. Although data collected periodically may represent conditions only at the time of observation, such data are useful in establishing seasonal relations between quality and streamflow and in predicting long-term sediment-discharge characteristics of the stream.
In addition to the records of suspended-sediment discharge, records of the periodic measurements of the particle-size distribution of the suspended sediment and bed material are included for some stations.
Laboratory Measurements
Samples for biochemical oxygen demand (BOD) and indicator bacteria are analyzed locally. All other samples are analyzed in the USGS laboratory in Lakewood, Colorado, unless otherwise noted. Methods used in analyzing sediment samples and computing sediment records are given in TWRI, Book 5, Chapter C1. Methods used by the USGS laboratories are given in the TWRIs, Book 1, Chapter D2; Book 3, Chapter C2; and Book 5, Chapters A1, A3, and A4. The TWRI publications may be accessed from http://water.usgs.gov/pubs/twri/. These methods are consistent with ASTM standards and generally follow ISO standards.
Data Presentation
For continuing-record stations, information pertinent to the history of station operation is provided in descriptive headings preceding the tabular data. These descriptive headings give details regarding location, drainage area, period of record, type of data available, instrumentation, general remarks, cooperation, and extremes for parameters currently measured daily. Tables of chemical, physical, biological, radiochemical data, and so forth, obtained at a frequency less than daily are presented first. Tables of "daily values" of specific conductance, pH, water temperature, dissolved oxygen, and suspended sediment then follow in sequence.
In the descriptive headings, if the location is identical to that of the discharge gaging station, neither the LOCATION nor the DRAINAGE AREA statements are repeated. The following information is provided with each continuous-record station. Comments that follow clarify information presented under the various headings of the station description.
LOCATION.-See Data Presentation information in the EXPLANATION OF STAGE- AND WATER-DISCHARGE RECORDS section of this report (same comments apply).
DRAINAGE AREA.-See Data Presentation information in the EXPLANATION OF STAGEAND WATER-DISCHARGE RECORDS section of this report (same comments apply).
PERIOD OF RECORD.-This indicates the time periods for which published water-quality records for the station are available. The periods are shown separately for records of parameters measured daily or continuously and those measured less than daily. For those measured daily or continuously, periods of record are given for the parameters individually.
INSTRUMENTATION.-Information on instrumentation is given only if a water-quality monitor temperature record, sediment pumping sampler, or other sampling device is in operation at a station.
REMARKS.-Remarks provide added information pertinent to the collection, analysis, or computation of the records.
COOPERATION.-Records provided by a cooperating organization or obtained for the USGS by a cooperating organization are identified here. EXTREMES.-Maximums and minimums are given only for parameters measured daily or more frequently. For parameters measured weekly or less frequently, true maximums or minimums may not have been obtained. Extremes, when given, are provided for both the period of record and for the current water year.
REVISIONS.-Records are revised if errors in published water-quality records are discovered. Appropriate updates are made in the USGS distributed data system, NWIS, and subsequently to its Web-based national data system, NWISWeb (http://waterdata.usgs.gov/nwis). Users of USGS water-quality data are encouraged to obtain all required data from NWIS or NWISWeb to ensure that they have the most recent updates. Updates to the NWISWeb are made on an annual basis.
The surface-water-quality records for partialrecord stations and miscellaneous sampling sites are published in separate tables following the table of discharge measurements at miscellaneous sites. No descriptive statements are given for these records. Each station is published with its own station number and name in the regular downstream-order sequence.
Remark Codes
The following remark codes may appear with the water-quality data in this section:
| Printed Output | Remark |
|---|---|
| E | Value is estimated. |
| > | Actual value is known to be greater than the value shown. |
| < | Actual value is known to be less than the value shown. |
| M | Presence of material verified, but not quantified. |
| N | Presumptive evidence of presence of material. |
| U | Material specifically analyzed for, but not detected. |
| A | Value is an average. |
| V | Analyte was detected in both the environmental sample and the associated blanks. |
| S | Most probable value. |
Water-Quality Control Data
The USGS National Water Quality Laboratory collects quality-control data on a continuing basis to evaluate selected analytical methods to determine long-term method detection levels (LTMDLs) and laboratory reporting levels (LRLs). These values are re-evaluated each year on the basis of the most recent quality-control data and, consequently, may change from year to year.
This reporting procedure limits the occurrence of false positive error. Falsely reporting a concentration greater than the LT-MDL for a sample in which the analyte is not present is 1 percent or less. Application of the LRL limits the occurrence of false negative error. The chance of falsely reporting a nondetection for a sample in which the analyte is present at a concentration equal to or greater than the LRL is 1 percent or less.
Accordingly, concentrations are reported as less than LRL for samples in which the analyte either was not detected or did not pass identification. Analytes detected at concentrations between the LT-MDL and the LRL and that pass identification criteria are estimated. Estimated concentrations will be noted with a remark code of "E." These data should be used with the understanding that their uncertainty is greater than that of data reported without the E remark code.
Data generated from quality-control (QC) samples are a requisite for evaluating the quality of the sampling and processing techniques as well as data from the actual samples themselves. Without QC data, environmental sample data cannot be adequately interpreted because the errors associated with the sample data are unknown. The various types of QC samples collected by a USGS Water Science Center are described in the following section. Procedures have been established for the storage of water-quality-control data within the USGS. These procedures allow for storage of all derived QC data and are identified so that they can be related to corresponding environmental samples. These data are not presented in this report but are available from the USGS Water Science Center in the State where the Station is located.
Blank Samples
Blank samples are collected and analyzed to ensure that environmental samples have not been contaminated in the overall data-collection process. The blank solution used to develop specific types of blank samples is a solution that is free of the analytes of interest. Any measured value signal in a blank sample for an analyte (a specific component measured in a chemical analysis) that was absent in the blank solution is believed to be due to contamination. Many types of blank samples are possible; each is designed to segregate a different part of the overall data-collection process. The types of blank samples potentially collected by USGS Water Science Centers are:
Field blank-A blank solution that is subjected to all aspects of sample collection, field processing preservation, transportation, and laboratory handling as an environmental sample.
Trip blank-A blank solution that is put in the same type of bottle used for an environmental sample and kept with the set of sample bottles before and after sample collection.
Equipment blank-A blank solution that is processed through all equipment used for collecting and processing an environmental sample (similar to a field blank but normally done in the more controlled conditions of the office).
Sampler blank-A blank solution that is poured or pumped through the same field sampler used for collecting an environmental sample.
Filter blank-A blank solution that is filtered in the same manner and through the same filter apparatus used for an environmental sample.
Splitter blank-A blank solution that is mixed and separated using a field splitter in the same manner and through the same apparatus used for an environmental sample.
Preservation blank-A blank solution that is treated with the sampler preservatives used for an environmental sample.
Reference Samples
Reference material is a solution or material prepared by a laboratory. The reference material composition is certified for one or more properties so that it can be used to assess a measurement method. Samples of reference material are submitted for analysis to ensure that an analytical method is accurate for the known properties of the reference material. Generally, the selected reference material properties are similar to the environmental sample properties.
Replicate Samples
Replicate samples are a set of environmental samples collected in a manner such that the samples are thought to be essentially identical in composition. Replicate is the general case for which a duplicate is the special case consisting of two samples. Replicate samples are collected and analyzed to establish the amount of variability in the data contributed by some part of the collection and analytical process. Many types of replicate samples are possible, each of which may yield slightly different results in a dynamic hydrologic setting, such as a flowing stream. The types of replicate samples collected in this district are:
Concurrent samples-A type of replicate sample in which the samples are collected simultaneously with two or more samplers or by using one sampler and alternating the collection of samples into two or more compositing containers.
Sequential samples-A type of replicate sample in which the samples are collected one after the other, typically over a short time.
Split sample-A type of replicate sample in which a sample is split into subsamples, each subsample contemporaneous in time and space.
Spike Samples
Spike samples are samples to which known quantities of a solution with one or more well-established analyte concentrations have been added. These samples are analyzed to determine the extent of matrix interference or degradation on the analyte concentration during sample processing and analysis.
Explanation of ground-water level records
Generally, only ground-water-level data from selected wells with continuous recorders from a basic network of observation wells are published in this report. This basic network contains observation wells located so that the most significant data are obtained from the fewest wells in the most important aquifers.
Site Identification Numbers
Each well is identified by means of (1) a 15- digit number that is based on latitude and longitude and (2) a local number that is produced for local needs. See NUMBERING SYSTEM FOR WELLS AND MISCELLANEOUS SITES in this report for a detailed explanation.
Data Collection and Computation
Measurements are made in many types of wells, under varying conditions of access and at different temperatures; hence, neither the method of measurement nor the equipment can be standardized. At each observation well, however, the equipment and techniques used are those that will ensure that measurements at each well are consistent.
Most methods for collecting and analyzing water samples are described in the TWRIs referred to in the Onsite Measurements and Sample Collection and the Laboratory Measurements sections in this report. In addition, TWRI Book 1, Chapter D2, describes guidelines for the collection and field analysis of ground-water samples for selected unstable constituents. Procedures for onsite measurements and for collecting, treating, and shipping samples are given in TWRIs Book 1, Chapter D2; Book 3, Chapters A1, A3, and A4; and Book 9, Chapters A1 through A9. The TWRI publications may be accessed from http:// water.usgs.gov/pubs/twri/. The values in this report represent water-quality conditions at the time of sampling, as much as possible, and that are consistent with available sampling techniques and methods of analysis. These methods are consistent with ASTM standards and generally follow ISO standards. Trained personnel collected all samples. The wells sampled were pumped long enough to ensure that the water collected came directly from the aquifer and had not stood for a long time in the well casing where it would have been exposed to the atmosphere and to the material, possibly metal, comprising the casings.
Water-level measurements in this report are given in feet with reference to land-surface datum (lsd). Land-surface datum is a datum plane that is approximately at land surface at each well. If known, the elevation of the land-surface datum above sea level is given in the well description. The height of the measuring point (MP) above or below land-surface datum is given in each well description. Water levels in wells equipped with recording gages are reported for every fifth day and the end of each month (EOM).
Water levels are reported to as many significant figures as can be justified by the local conditions. For example, in a measurement of a depth of water of several hundred feet, the error in determining the absolute value of the total depth to water may be a few tenths of a foot, whereas the error in determining the net change of water level between successive measurements may be only a hundredth or a few hundredths of a foot. For lesser depths to water the accuracy is greater. Accordingly, most measurements are reported to a hundredth of a foot, but some are given only to a tenth of a foot or a larger unit.
Data Presentation
Water-level data are presented in alphabetical order by county. The primary identification number for a given well is the 15-digit site identification number that appears in the upper left corner of the table. The secondary identification number is the local or county well number. Well locations are shown and each well is identified by its local well or county well number on a map in the local Water Science Center's Annual Scientific Investigation Report by State, and may be accessed from. . .
Each well record consists of three parts: the well description, the data table of water levels observed during the water year, and, for most wells, a hydrograph following the data table. Well descriptions are presented in the headings preceding the tabular data. The following comments clarify information presented in these various headings.
LOCATION.-This paragraph follows the well-identification number and reports the hydrologic-unit number and a geographic point of reference. Latitudes and longitudes used in this report are reported as North American Datum of 1927 unless otherwise specified.
AQUIFER-.This entry designates by name and geologic age the aquifer that the well taps.
WELL CHARACTERISTICS-.This entry describes the well in terms of depth, casing diameter and depth or screened interval, method of construction, use, and changes since construction.
INSTRUMENTATION-.This paragraph provides information on both the frequency of measurement and the collection method used, allowing the user to better evaluate the reported water-level extremes by knowing whether they are based on continuous, monthly, or some other frequency of measurement.
DATUM-.This entry describes both the measuring point and the land-surface elevation at the well. The altitude of the land-surface datum is described in feet above the altitude datum; it is reported with a precision depending on the method of determination. The measuring point is described physically (such as top of casing, top of instrument shelf, and so forth), and in relation to land surface (such as 1.3 ft above land-surface datum). The elevation of the land-surface datum is described in feet above National Geodetic Vertical Datum of 1929 (NGVD 29); it is reported with a precision depending on the method of determination.
REMARKS-.This entry describes factors that may affect the water level in a well or the measurement of the water level, when various methods of measurement were begun, and the network (climatic, terra ne, local, or areal effects) or the special project to which the well belongs.
PERIOD OF RECORD.-This entry indicates the time period for which records are published for the well, the month and year at the start of publication of water-level records by the USGS, and the words "to current year" if the records are to be continued into the following year. Time periods for which water-level records are available, but are not published by the USGS, may be noted.
EXTREMES FOR PERIOD OF RECORD.-This entry contains the highest and lowest instantaneously recorded or measured water levels of the period of published record, with respect to land-surface datum or sea level, and the dates of occurrence.
Water-Level Tables
A table of water levels follows the well description for each well. Water-level measurements in this report are given in feet with reference to either sea level or land-surface datum (lsd). Missing records are indicated by dashes in place of the water-level value.
For wells not equipped with recorders, water-level measurements were obtained periodically by steel or electric tape. Tables of periodic water-level measurements in these wells show the date of measurement and the measured water-level value.
Hydrographs
Hydrographs are a graphic display of water-level fluctuations over a period of time. In this report, current water year and, when appropriate, period-of-record hydrographs are shown.
Hydrographs that display periodic water-level measurements show points that may be connected with a dashed line from one measurement to the next. Hydrographs that display recorder data show a solid line representing the mean water level recorded for each day. Missing data are indicated by a blank space or break in a hydrograph. Missing data may occur as a result of recorder malfunctions, battery failures, or mechanical problems related to the response of the recorder's float mechanism to water-level fluctuations in a well.
Ground-water-quality data
Data Collection and Computation
The ground-water-quality data in this report were obtained as a part of special studies in specific areas. Consequently, a number of chemical analyses are presented for some wells within a county but not for others. As a result, the records for this year, by themselves, do not provide a balanced view of ground-water quality statewide. Most methods for collecting and analyzing water samples are described in the TWRIs, which may be accessed from http://water.usgs.gov/pubs/twri/. Procedures for onsite measurements and for collecting, treating, and shipping samples are given in TWRI, Book 1, Chapter D2; Book 5, Chapters A1, A3, and A4; and Book 9, Chapters A1-A6. Also, detailed information on collecting, treating, and shipping samples may be obtained from the local USGS Water Science Center.
Laboratory Measurements
Analysis for sulfide and measurement of alkalinity, pH, water temperature, specific conductance, and dissolved oxygen are performed onsite. All other sample analyses are performed at the USGS laboratory in Lakewood, Colorado, unless otherwise noted. Methods used by the USGS laboratory are given in TWRI, Book 1, Chapter D2 and Book 5, Chapters A1, A3, and A4, which may be accessed from http://water.usgs.gov/pubs/twri/.

![]() U.S. Department of the Interior |
U.S. Geological Survey
U.S. Department of the Interior |
U.S. Geological Survey
URL:
Questions about sites/data should be directed to Water Webserver Team
Page Contact Information: Water Data Report Team
Page Last Modified: